
Where do you actually show up on Google Maps?
Your ranking is not the same 500 metres from your door as it is 5 kilometres away. GMB Manager measures your local ranking point by point around your business, keyword by keyword.
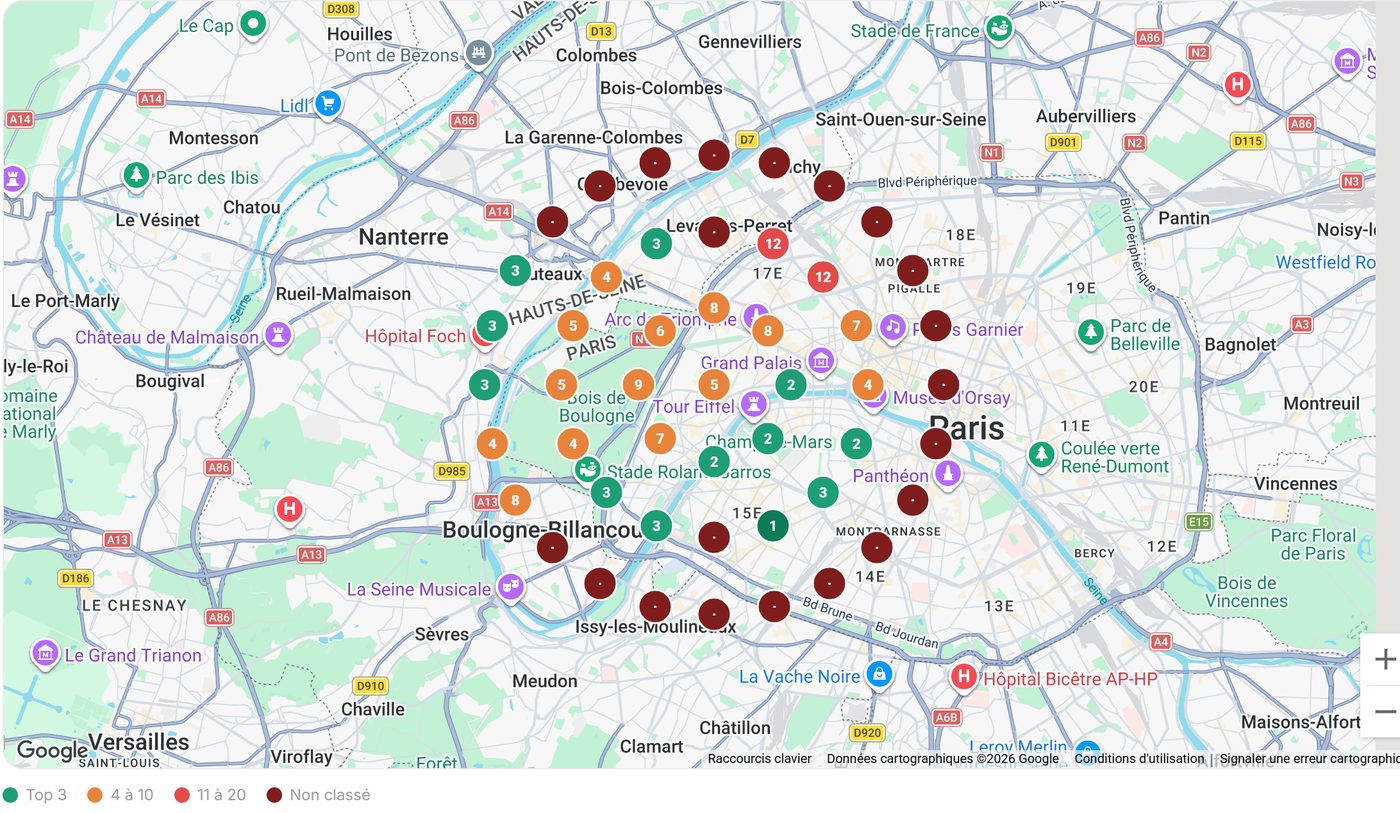
Every dot is a real measurement
The report simulates a Google search at each point of the grid and records where your profile lands in the local results, at that exact spot.
Three settings, then it runs on its own
Up to 50 keywords per location: "beauty salon", "emergency plumber", whatever your customers actually type.
Square or circular grid, up to 13×13 points, spacing of your choice. Cover your neighbourhood or the whole city.
A report scheduled every week, on the day you choose. Need an immediate check? A manual scan starts in one click.
A snapshot proves nothing, a trend does
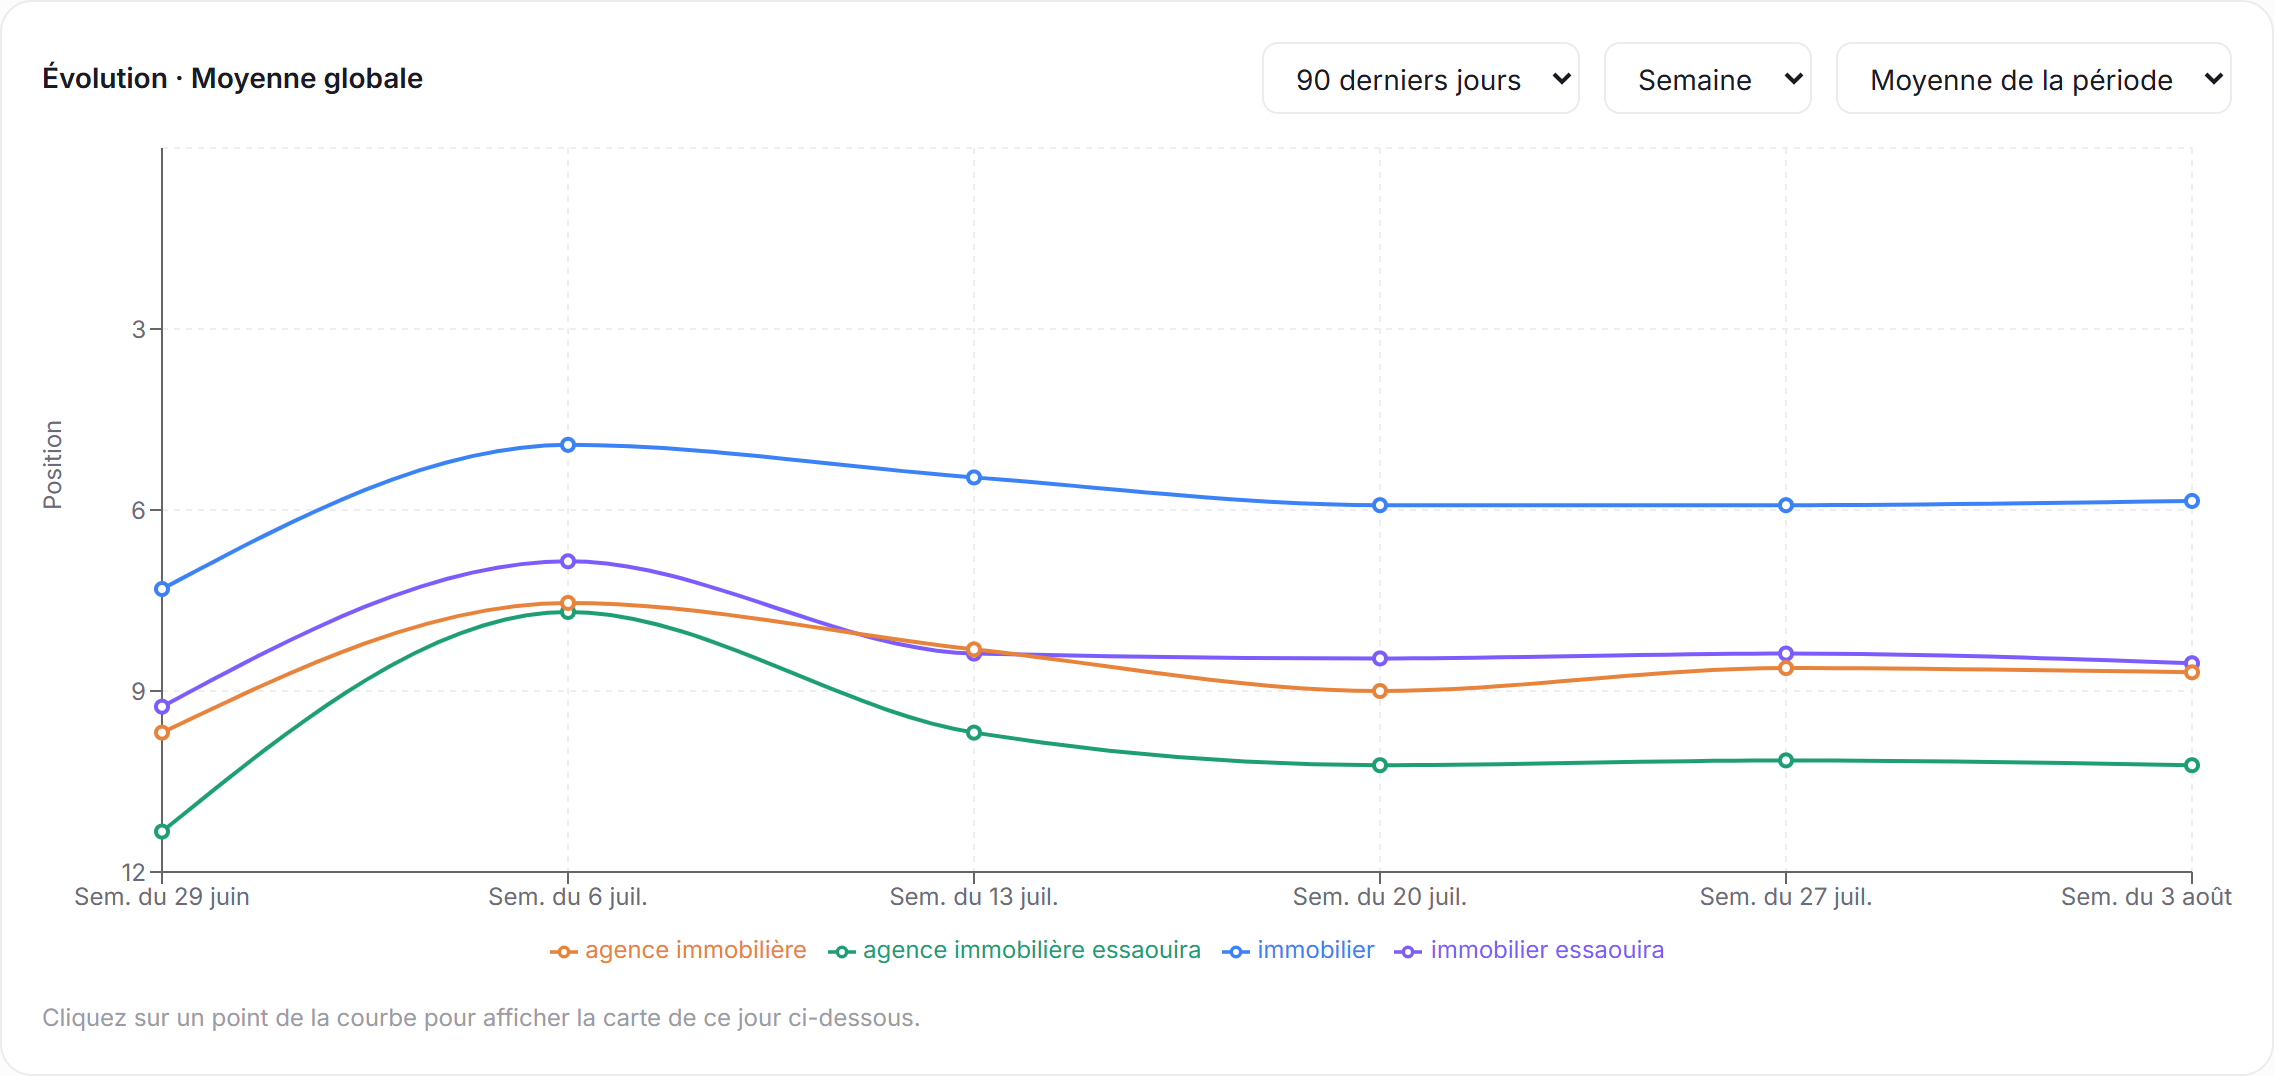
Each report stacks on the previous ones and draws your trend curves: average position, share of voice in the top 3, areas won and lost. That is the proof your SEO work is paying off, keyword by keyword.
Changing the size or the shape of your grid? The history is kept: the curves continue over the shared area and flag the change.

You know who is ahead of you, where, and on what
Up to 20 competitors tracked on the same points and the same keywords as you. The report shows their position next to yours, area by area: you see exactly where the battle is and where to focus.
Four numbers that say it all
Your average ranking across the whole grid, for a given keyword.
The share of the area where you appear in the first three results.
Positions gained or lost since the previous report.
The neighbourhoods where you dominate and those where customers cannot see you.
What people ask us about rank tracking
Where do the measurements come from?▾
How often are reports produced?▾
Can I change my grid without losing the history?▾
How much does it consume?▾
Can my own clients look at the reports?▾
So, how far does your Google profile actually reach?
GMB Manager is provided by the CogitoWeb agency as part of its local SEO service.